Project: Launching an EPIC Dashboard for Louisiana


Billions in federal COVID-19 relief funds poured into Louisiana schools between 2021 and 2024. But how were systems using the funds? Beginning in 2022, the Louisiana Department of Education partnered with the Region 14 Comprehensive Center to design a groundbreaking fiscal data visualization solution—EPIC (Education Progress and Investment Charts). EPIC uses artificial intelligence to make data on Louisiana’s ESSER investments and outcomes clear and accessible.
Download this impactful story— its printer-friendly and perfect for sharing the success with your network!
ESSER Investments and Outcomes Dashboard
Effectively tracking Elementary and Secondary School Emergency Relief (ESSER) spending requires a novel approach to data visualization. The Region 14 Comprehensive Center (R14CC) team, led by Boris Granovskiy, PhD, joined forces with web development experts from Attuned and Exponent Education. Together, they created the ESSER Investments + Outcomes Dashboard using an intricate data visualization process through effective communication and collaboration.
“Knowing how school systems are spending their ESSER dollars and what resources they are prioritizing provides a better understanding of how to allocate existing and new education funds. It is a pivotal insight into ensuring schools and students receive precisely what they need the most.”
-Boris Granovskiy, PhD, Region 14 Comprehensive Center
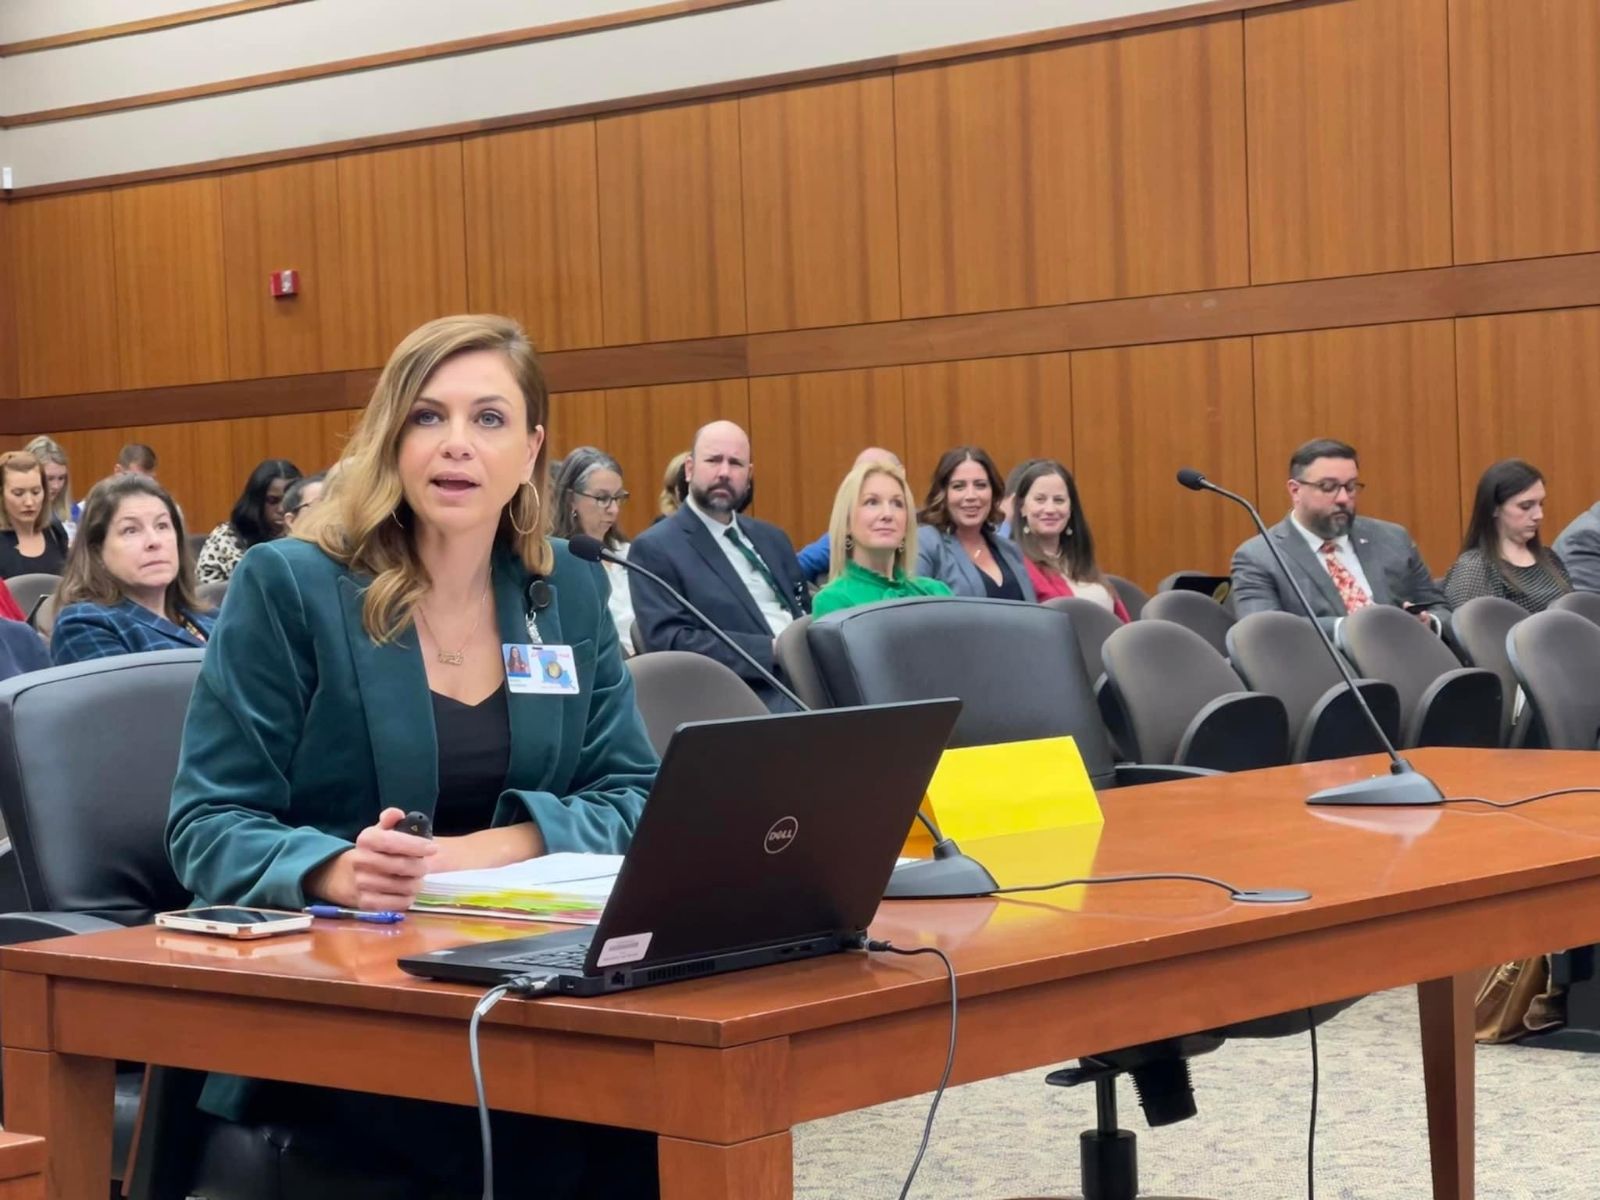
The LDOE presents the EPIC Dashboard Portal at a Louisiana State Board of Elementary and Secondary Education meeting.
Data Visualization Powered by Machine Learning
The Louisiana Department of Education (LDOE) was already collecting data in narrative form to understand how schools planned to spend ESSER funds. To reduce the burden on the LDOE and its school systems, the R14CC team created a solution to organize the existing data collection for integration into the dashboard.
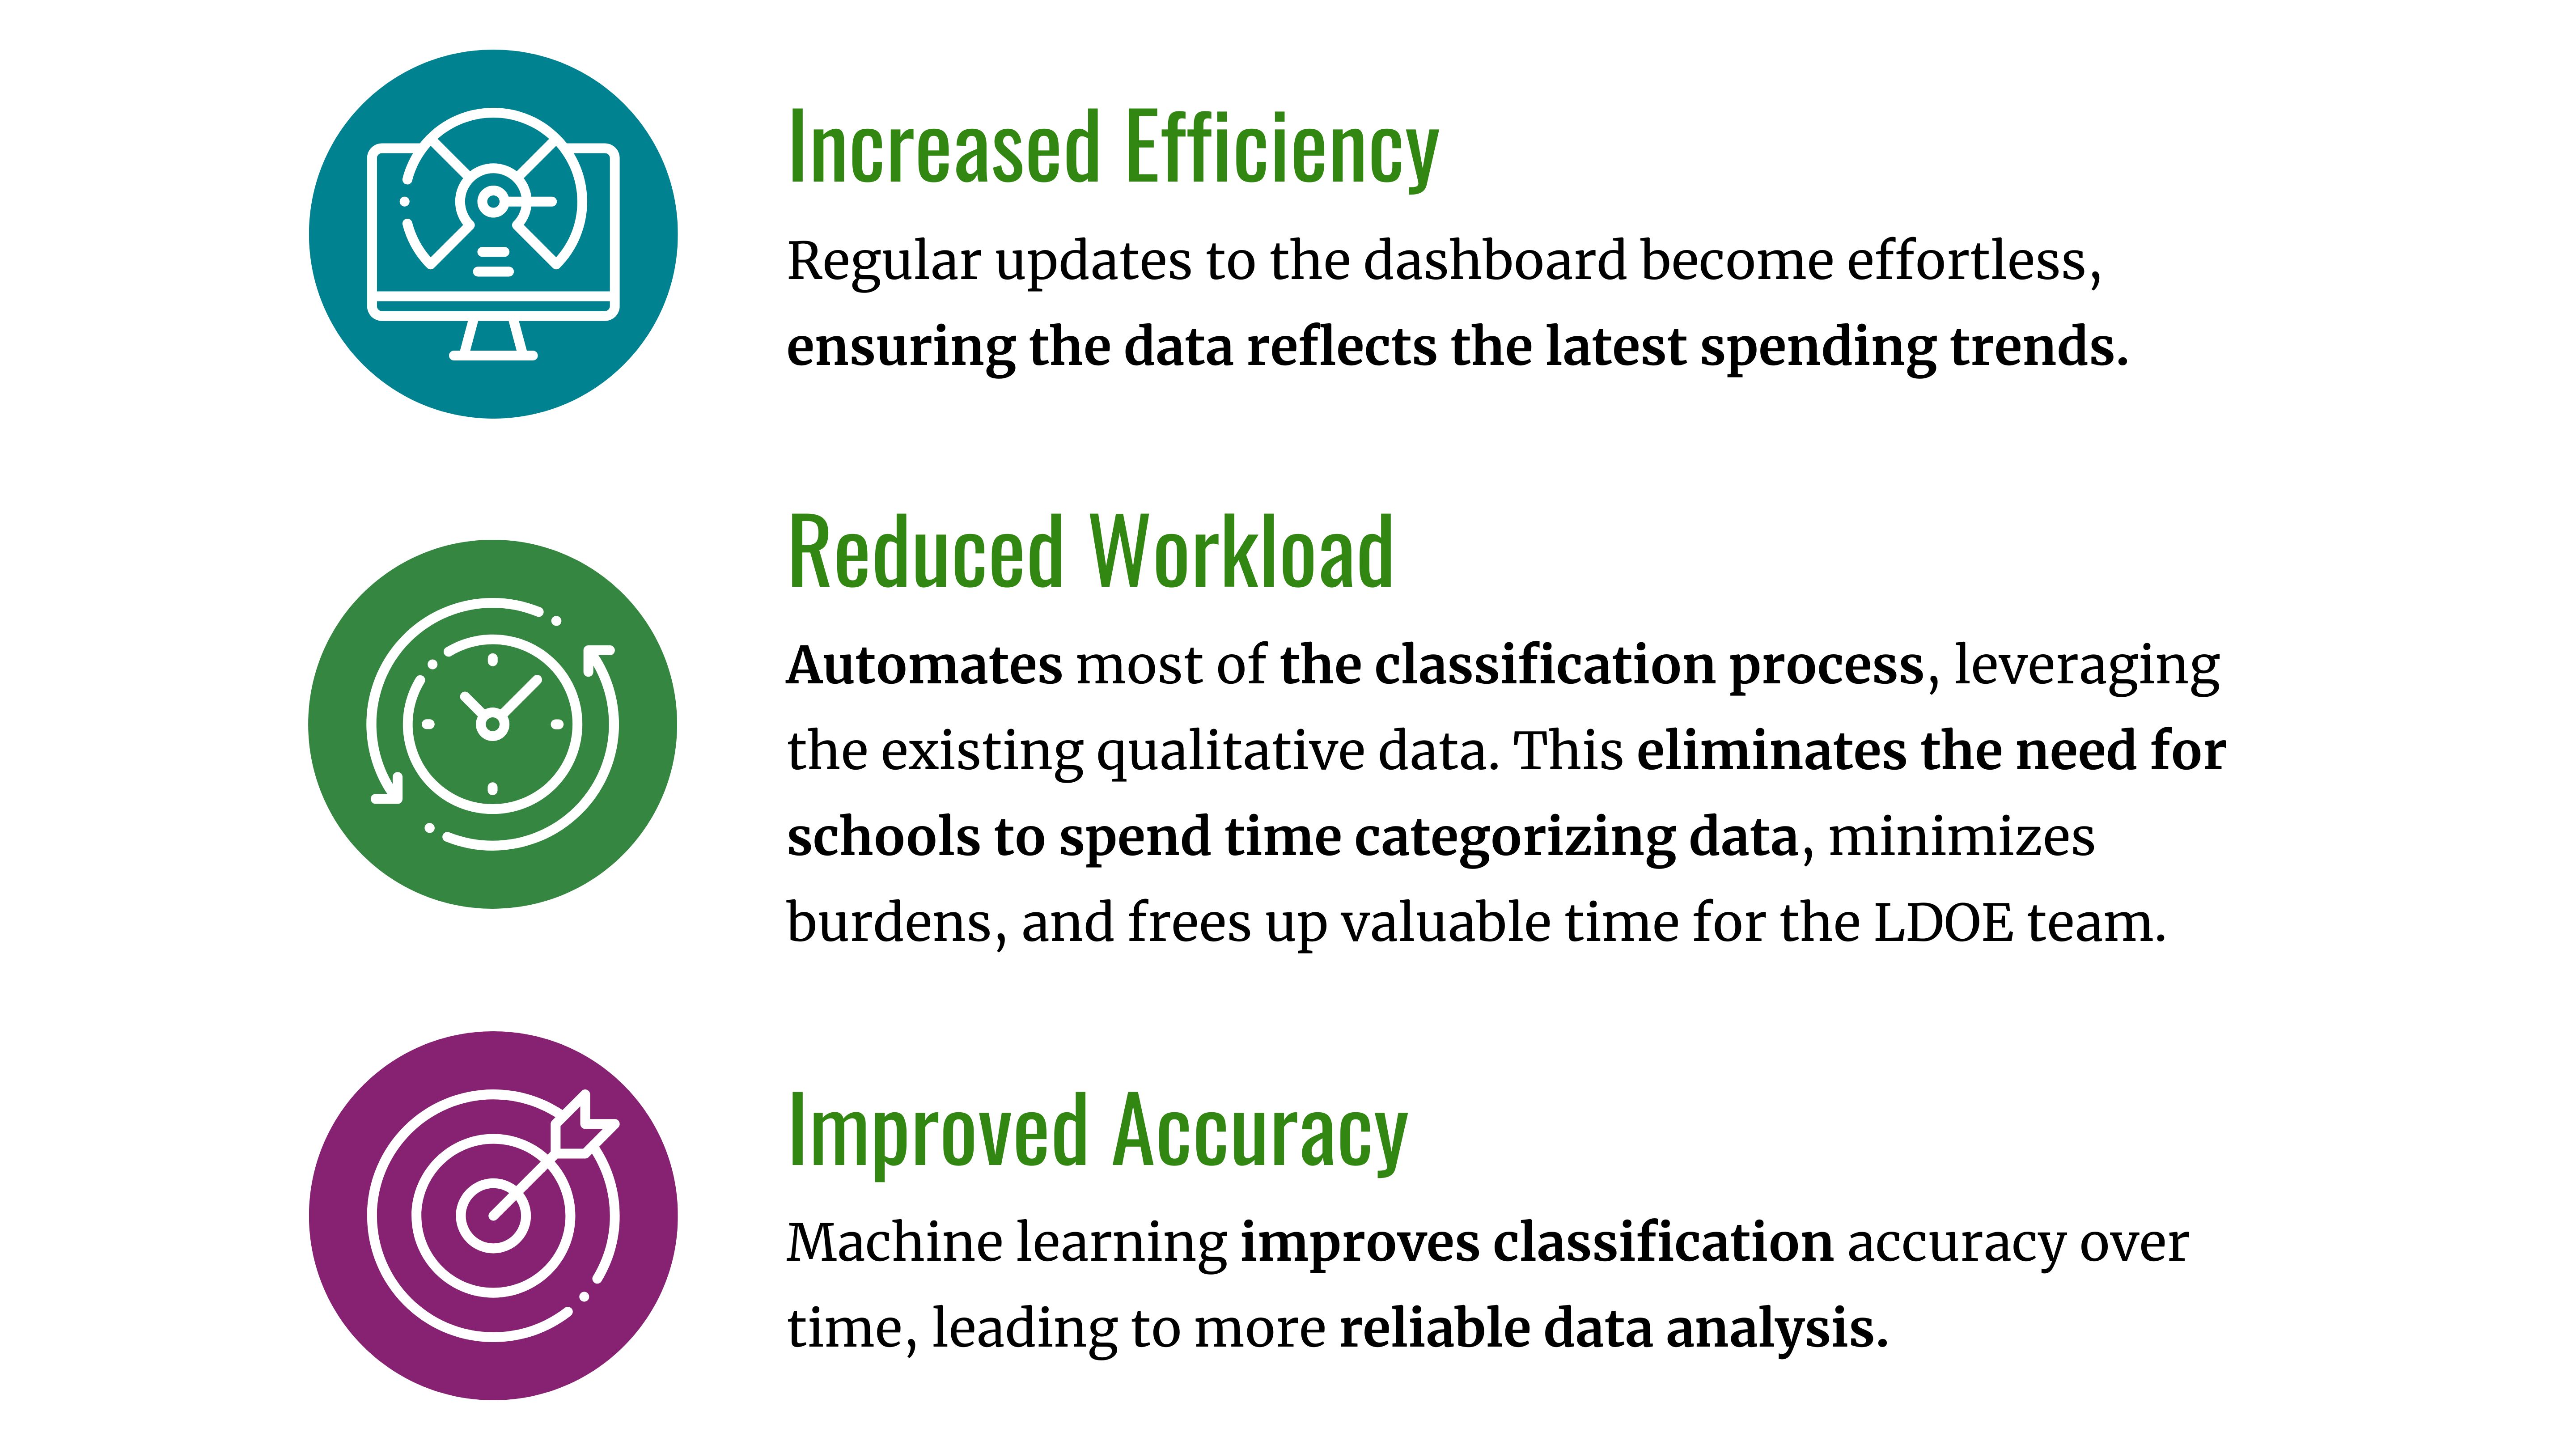
Granovskiy collaborated with data management, data visualization, and data analytics experts from the R14CC team to develop an automated algorithm fueled by machine learning, a specific artificial intelligence (AI) branch. Training this algorithm to classify the local education agencies’ ESSER investments according to pre-defined categories eliminates manual coding and enables:
Educator Feedback and Iterative Improvement
Following initial development, the R14CC team prioritized educators’ and administrators’ user feedback. This input directly shaped the dashboard’s design and functionality, ensuring it effectively addressed user needs. The insights gained were turned into tangible dashboard improvements. Superintendents and educators shared with the R14CC team the value of readily available system-wide data, noting its potential for performance comparison and identifying areas for improvement.
Granovskiy also underscored the significance of this iterative process, emphasizing, “A profound understanding of user needs empowered the LDOE team to intricately tailor the dashboard design, effectively addressing those needs.”
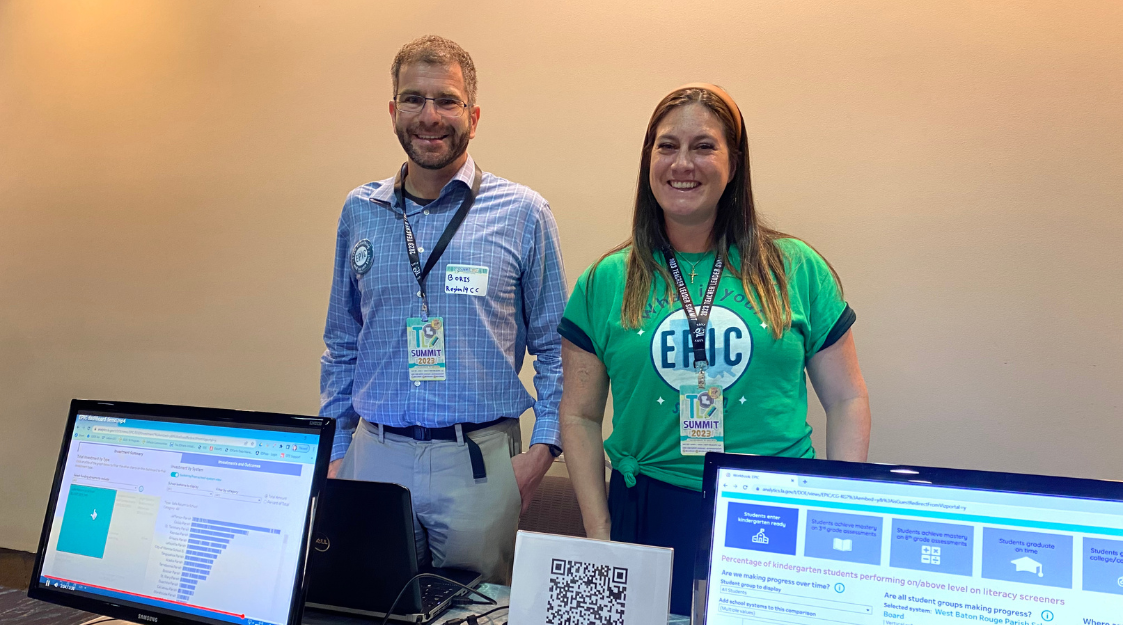
Boris Granovskiy and Kristen Pugh from the Region 14 Comprehensive Center demo the EPIC Dashboard for attendees at the 2023 Teacher Leader Summit in New Orleans, Louisiana.
“Transparency Builds Trust”
Easy access to this valuable data has allowed researchers and policymakers to examine the relationship between specific ESSER-funded investments school systems have made during the pandemic and the academic outcomes of their students. The LDOE ensures continuous transparency of current ESSER spending data by focusing on long-term usability. This effort is complemented by two additional EPIC dashboards that display student achievement and LDOE initiatives:
The Critical Goals Dashboard focuses on Louisiana students’ academic outcomes on various assessments at all K–12 education levels and for all student subgroups. Each assessment is tied to one of the six critical goals defined in LDOE’s most recent strategic plan.
The Priority Indicators Dashboard is LDOE’s public accountability tool. It provides visibility into the progress and direction of department efforts aligned with the key priorities guiding LDOE’s vision for success.
EPIC serves as more than a collection of data points—it shines a light on school spending, student achievement, and statewide progress toward educational goals. At its core, EPIC empowers every Louisianan to see firsthand how their tax dollars are invested in education and how effectively those investments support student success.
“Transparency builds trust and this new tool shines light on education outcomes and funding.”
-Dr. Cade Brumley, LDOE State Superintendent of Education